Firefox memory viz

About:Memory for Real People
About:Memory for Real People aimed to convey memory consumption statistics to web developers as well as regular users. This was a project I designed and built for Mozilla, as part of Google Summer of Code.
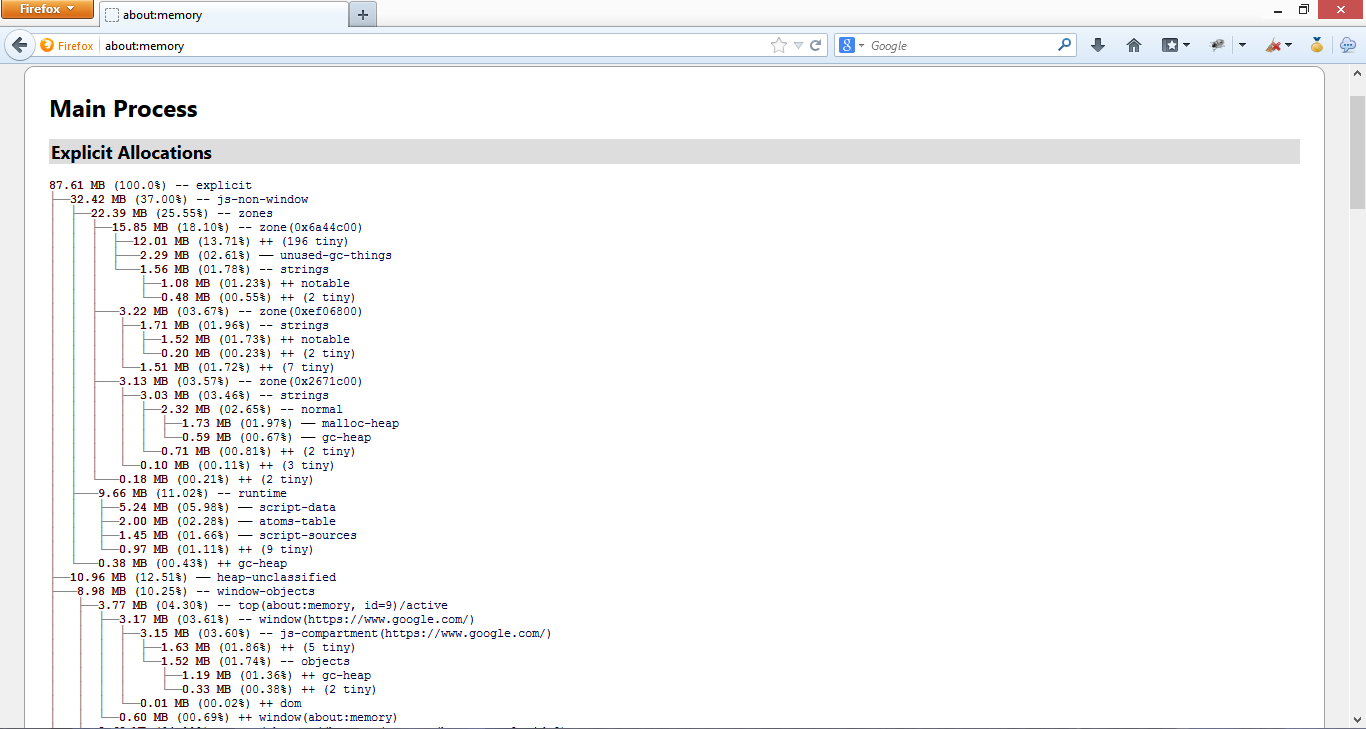
The then-current About:Memory page was primarily used by Firefox browser developers for various profiling. Profile and process trees can inherently be difficult to read given the depth and the sometimes-jargony titles. The plan was to present this information in a visual way to express the exhaustive details in a concise manner for easy outlier/anomaly detection, and identification of interesting changes in the memory utilization.
The primary objectives of this project were to:
- Express information and functionalities in the easiest possible manner.
- Keep the data unabridged.
- Make the new page itself consume as little memory as possible (this was a bummer considering visualizations are very memory-intensive).
- Visualizing the Memory Tree
The new design uses three primary forms of data visualizations – donut charts, line charts, and sunburst charts – to account for both basic as well as verbose views. It is kept visually in sync with the About:Healthreport page.
Features of the New Design
Header
The new header allows users to switch between the Raw Data view and the new Memory Report view. The Raw Data section would display a similar text-based memory tree like the one on the current About:Memory page. The Memory Report section is illustrated below. The three buttons on the header in the top right corner account for GC (garbage collection), CC (cycle collection), and minimize memory usage functionalities.
Key Stats and Functions
- Functionalities to load and save reports.
- Combined statistics about memory consumption by Tabs, Add-Ons, and System. "System" here will be a bucket for all the memory compartments, allocations, and listings that do not contribute to either Tabs or Add-Ons.
- Functionalities to close inactive tabs (i.e., tabs that are still about:blank in memory because of the "Do not load tabs until selected" feature).
- Functionalities to disable add-ons, extensions, and plugins.
Grouped / Aggregated View (aggregate pie chart)
Three main views – Grouped, Live, and Verbose – will be used to display the various visualizations.
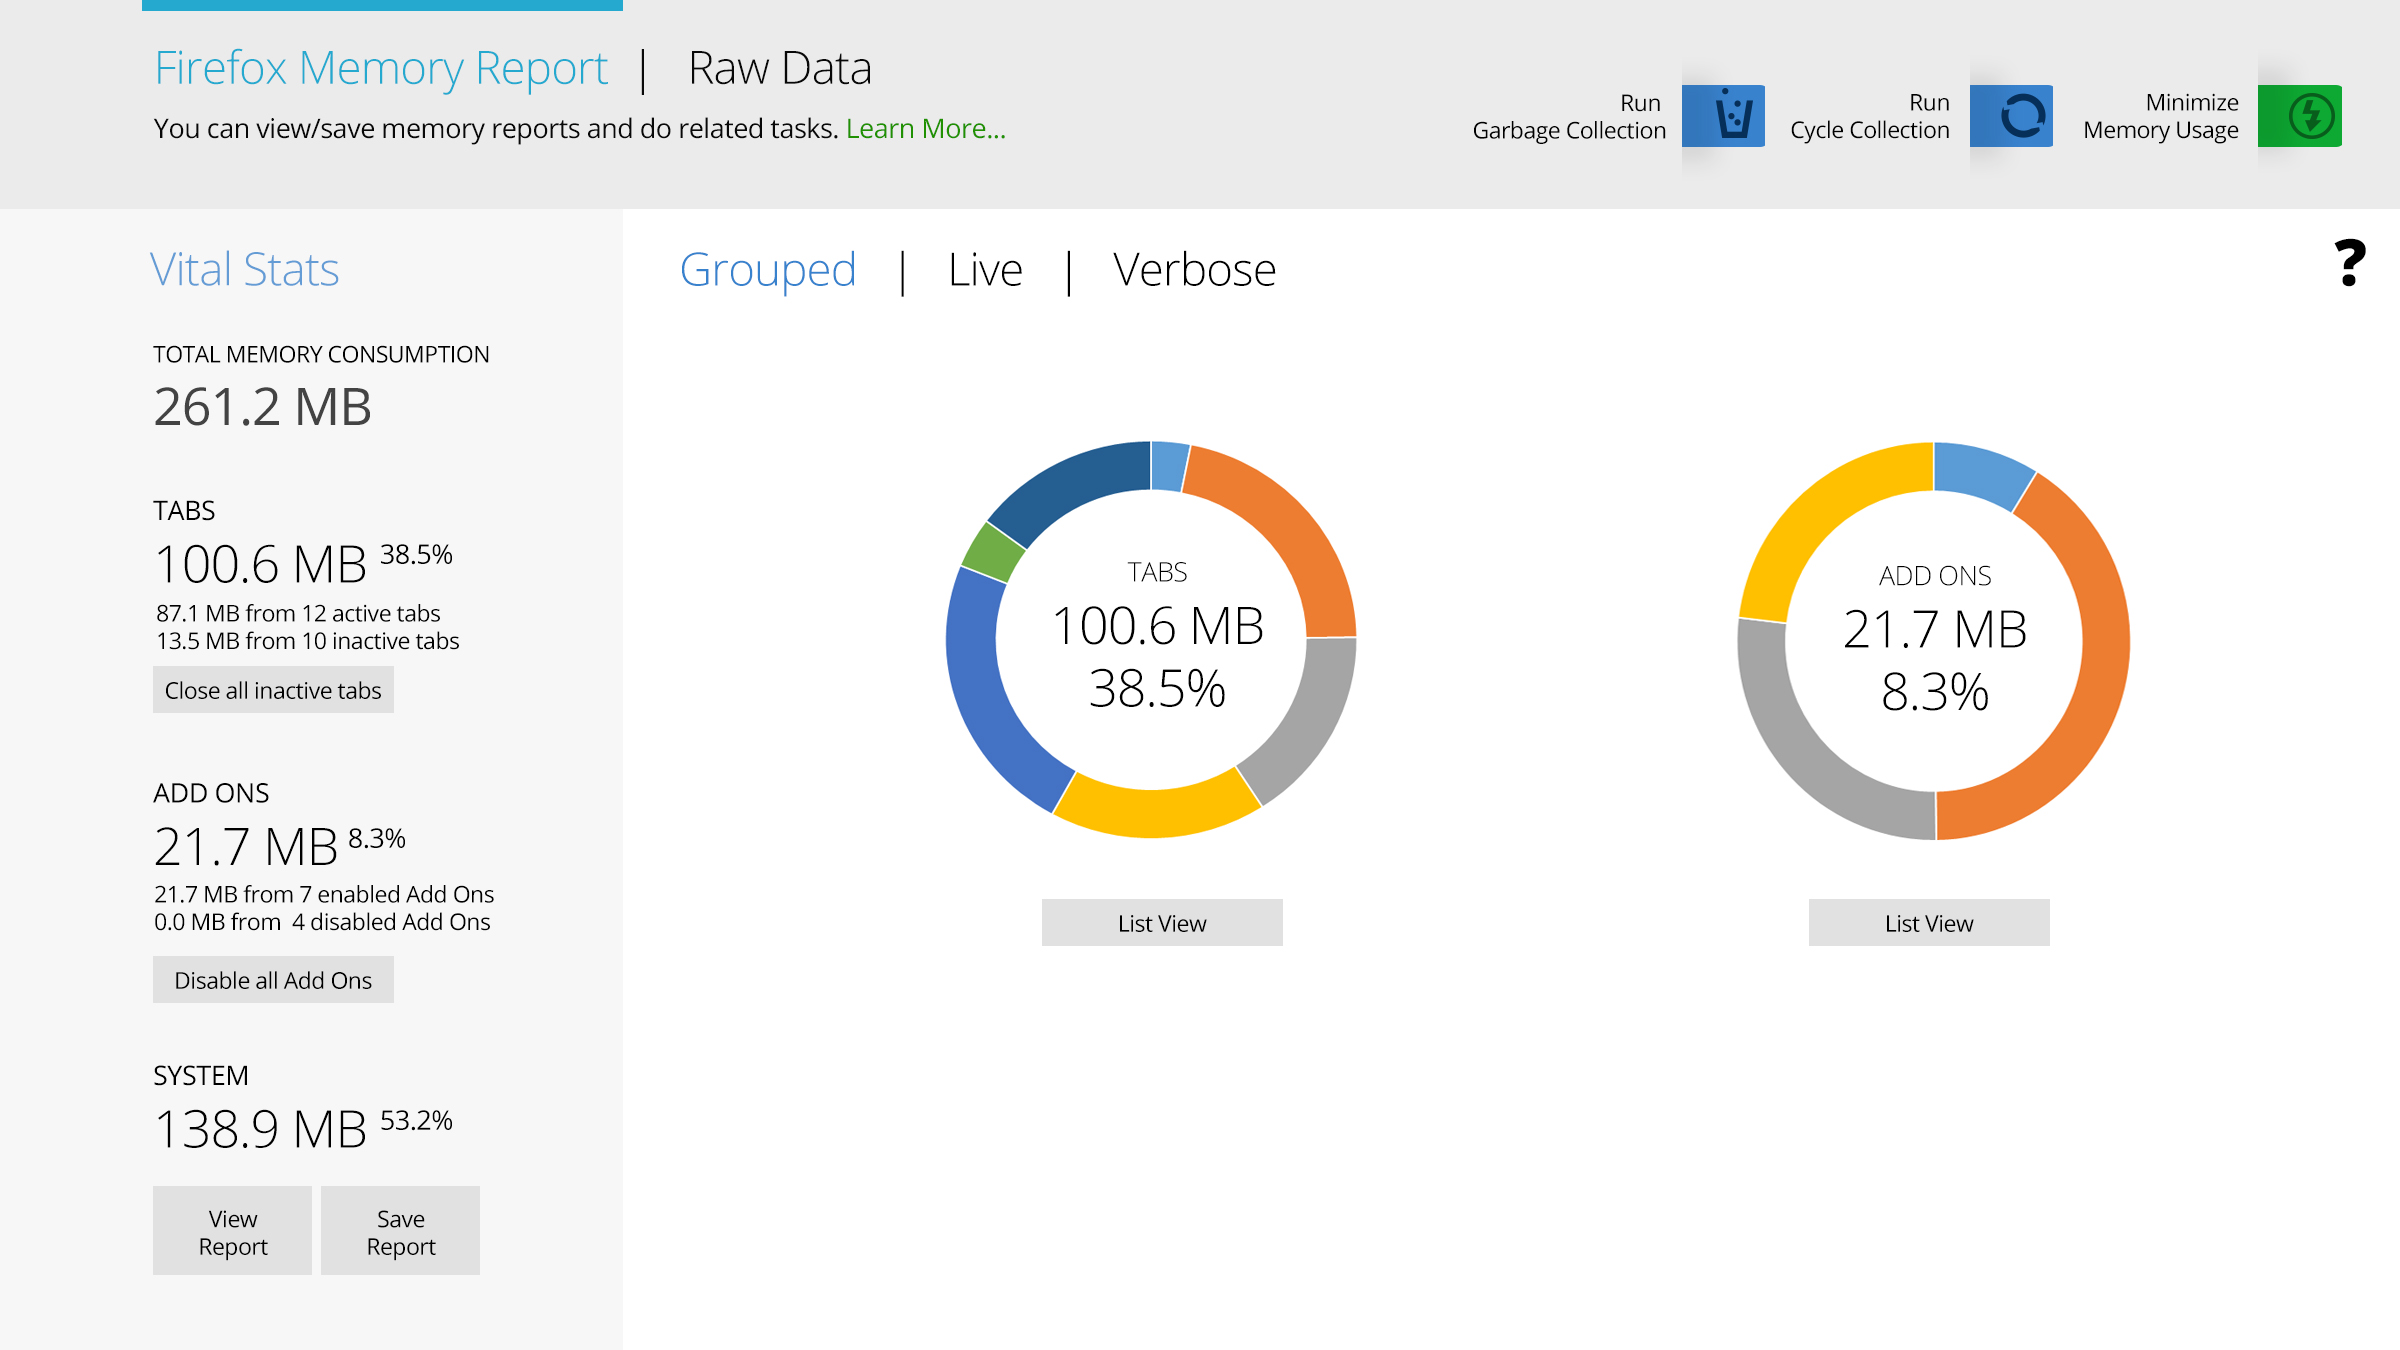
In the Grouped view, users can see two major categories, namely the tabs and the Add-Ons. Donut charts are used to illustrate the same because they give an abstract view of the proportions of memory used by each tab, just like pie charts. Hovering over a partition of the donut chart will reveal more information about the consumption statistics by that partition. In the case of a large number of tabs or add-ons, people can alternatively switch to a list view to view precise data related to all the tabs in a more convenient manner. The list view will also allow users to sort tabs in ascending or descending orders and to selectively close tabs.
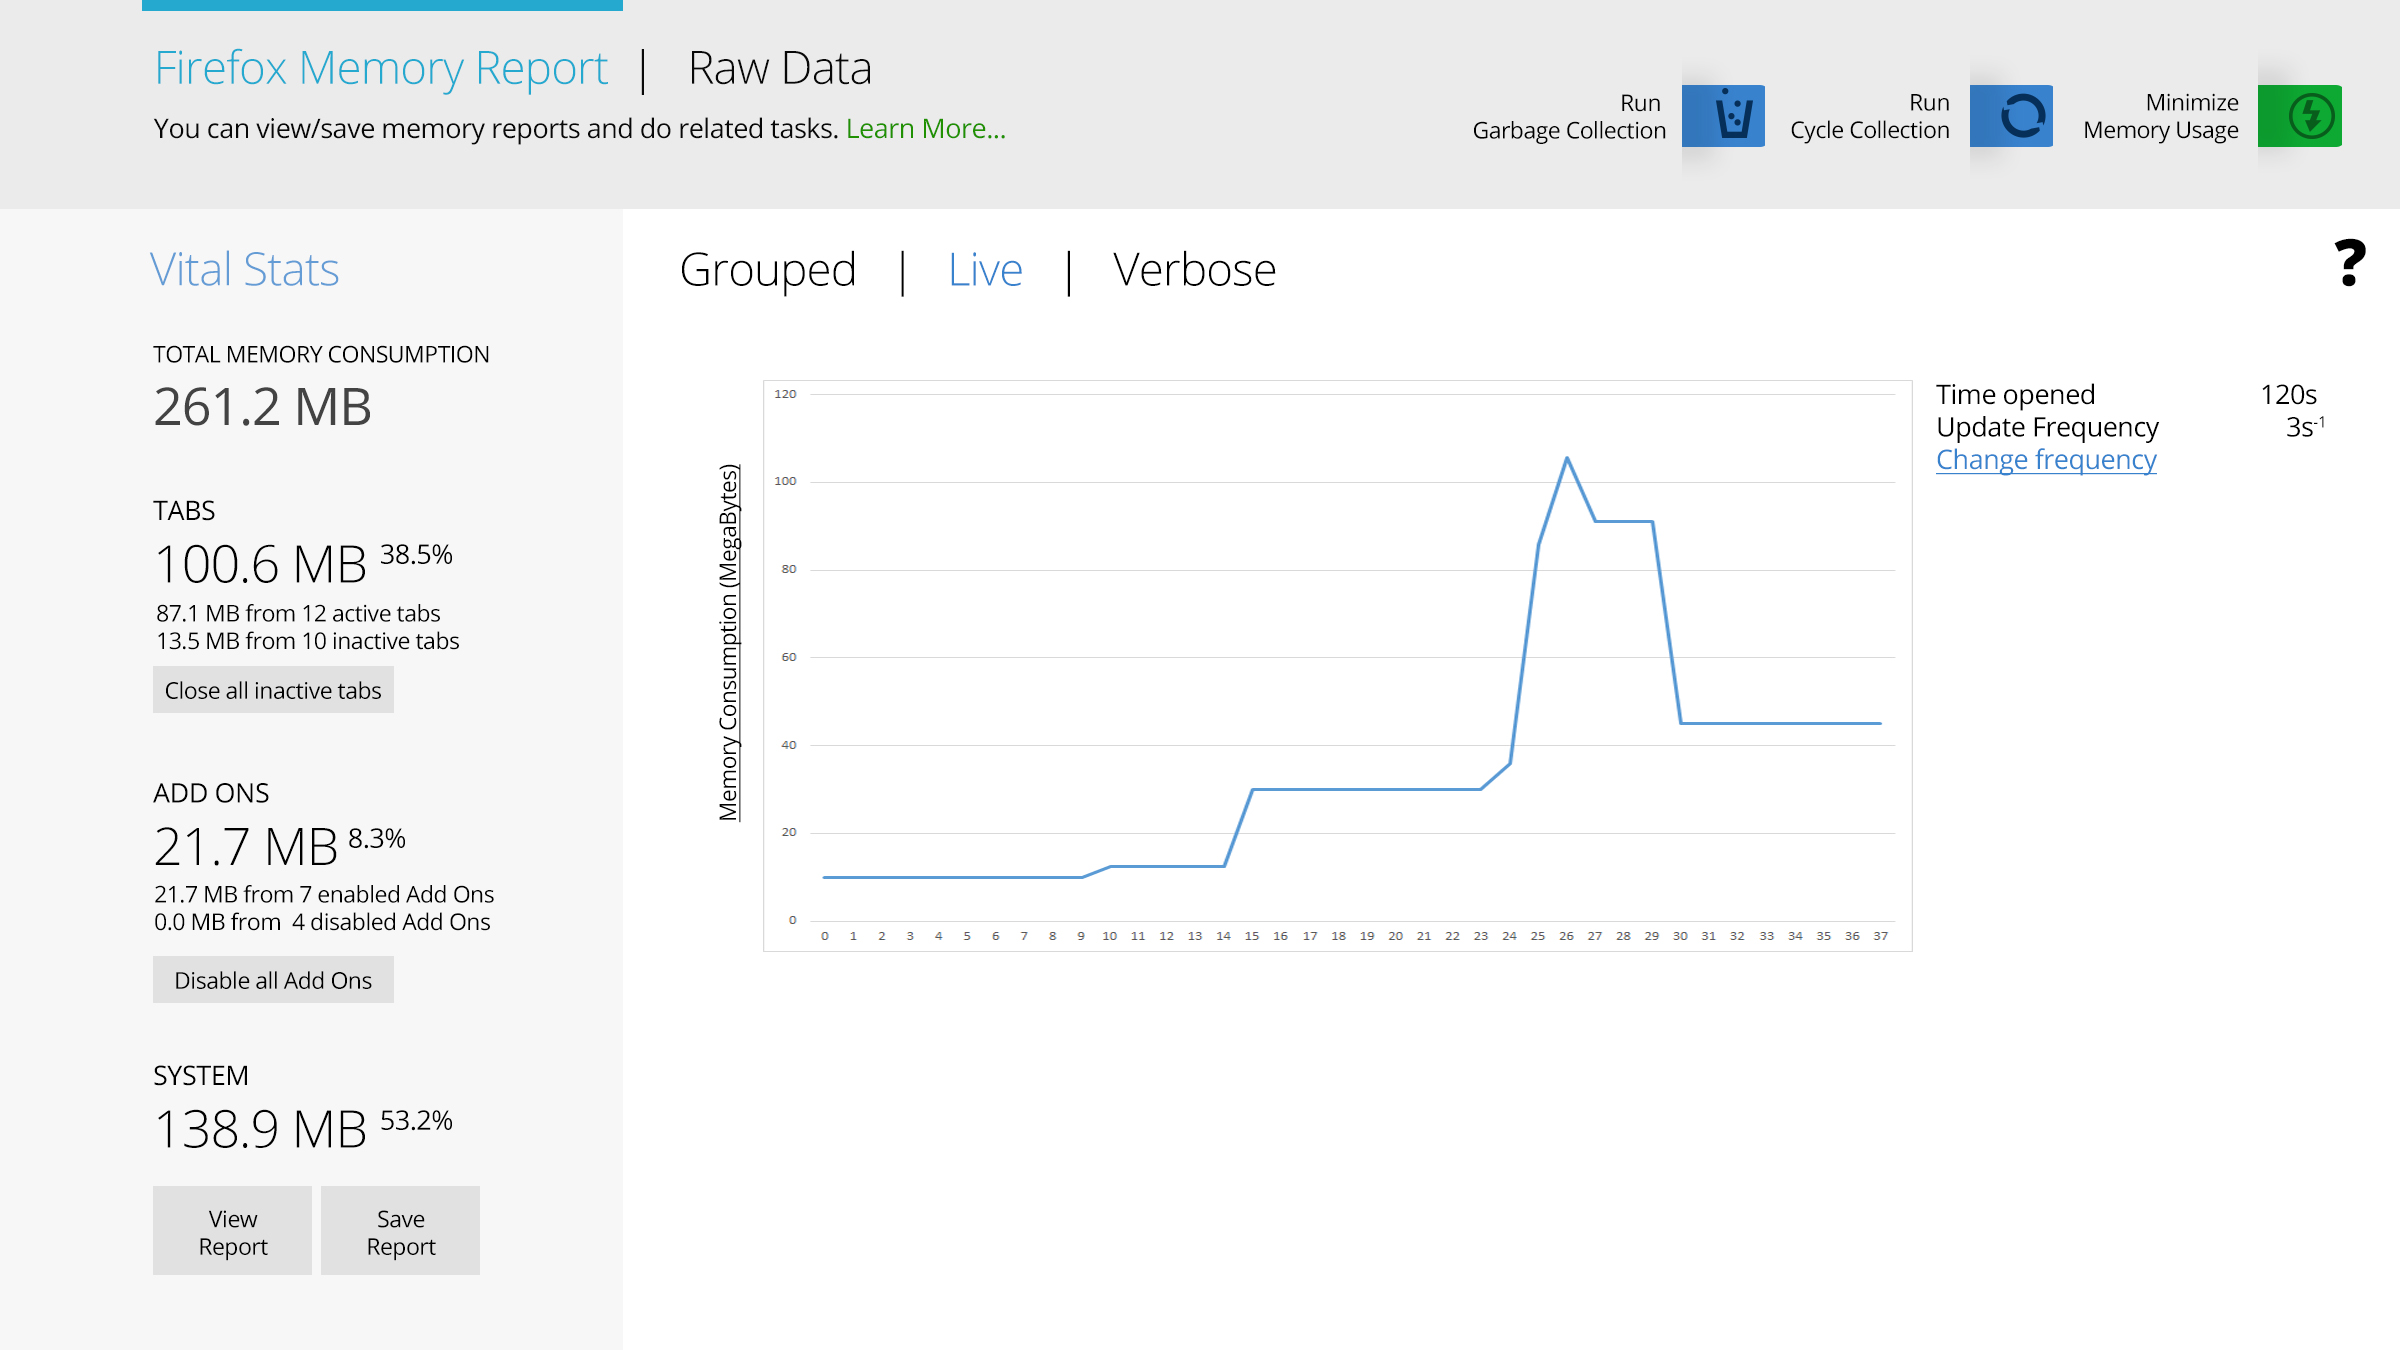
Live view (timeseries line graph)
The live view visualized real-time memory consumption. This data was streamed at a frequency of 1.5s-1. The resulting timeseries line graph had to perform several optimizations to be able to handle that frequency in browser.
Verbose flat tree view (ungrouped nested tree visualized as a sunburst)
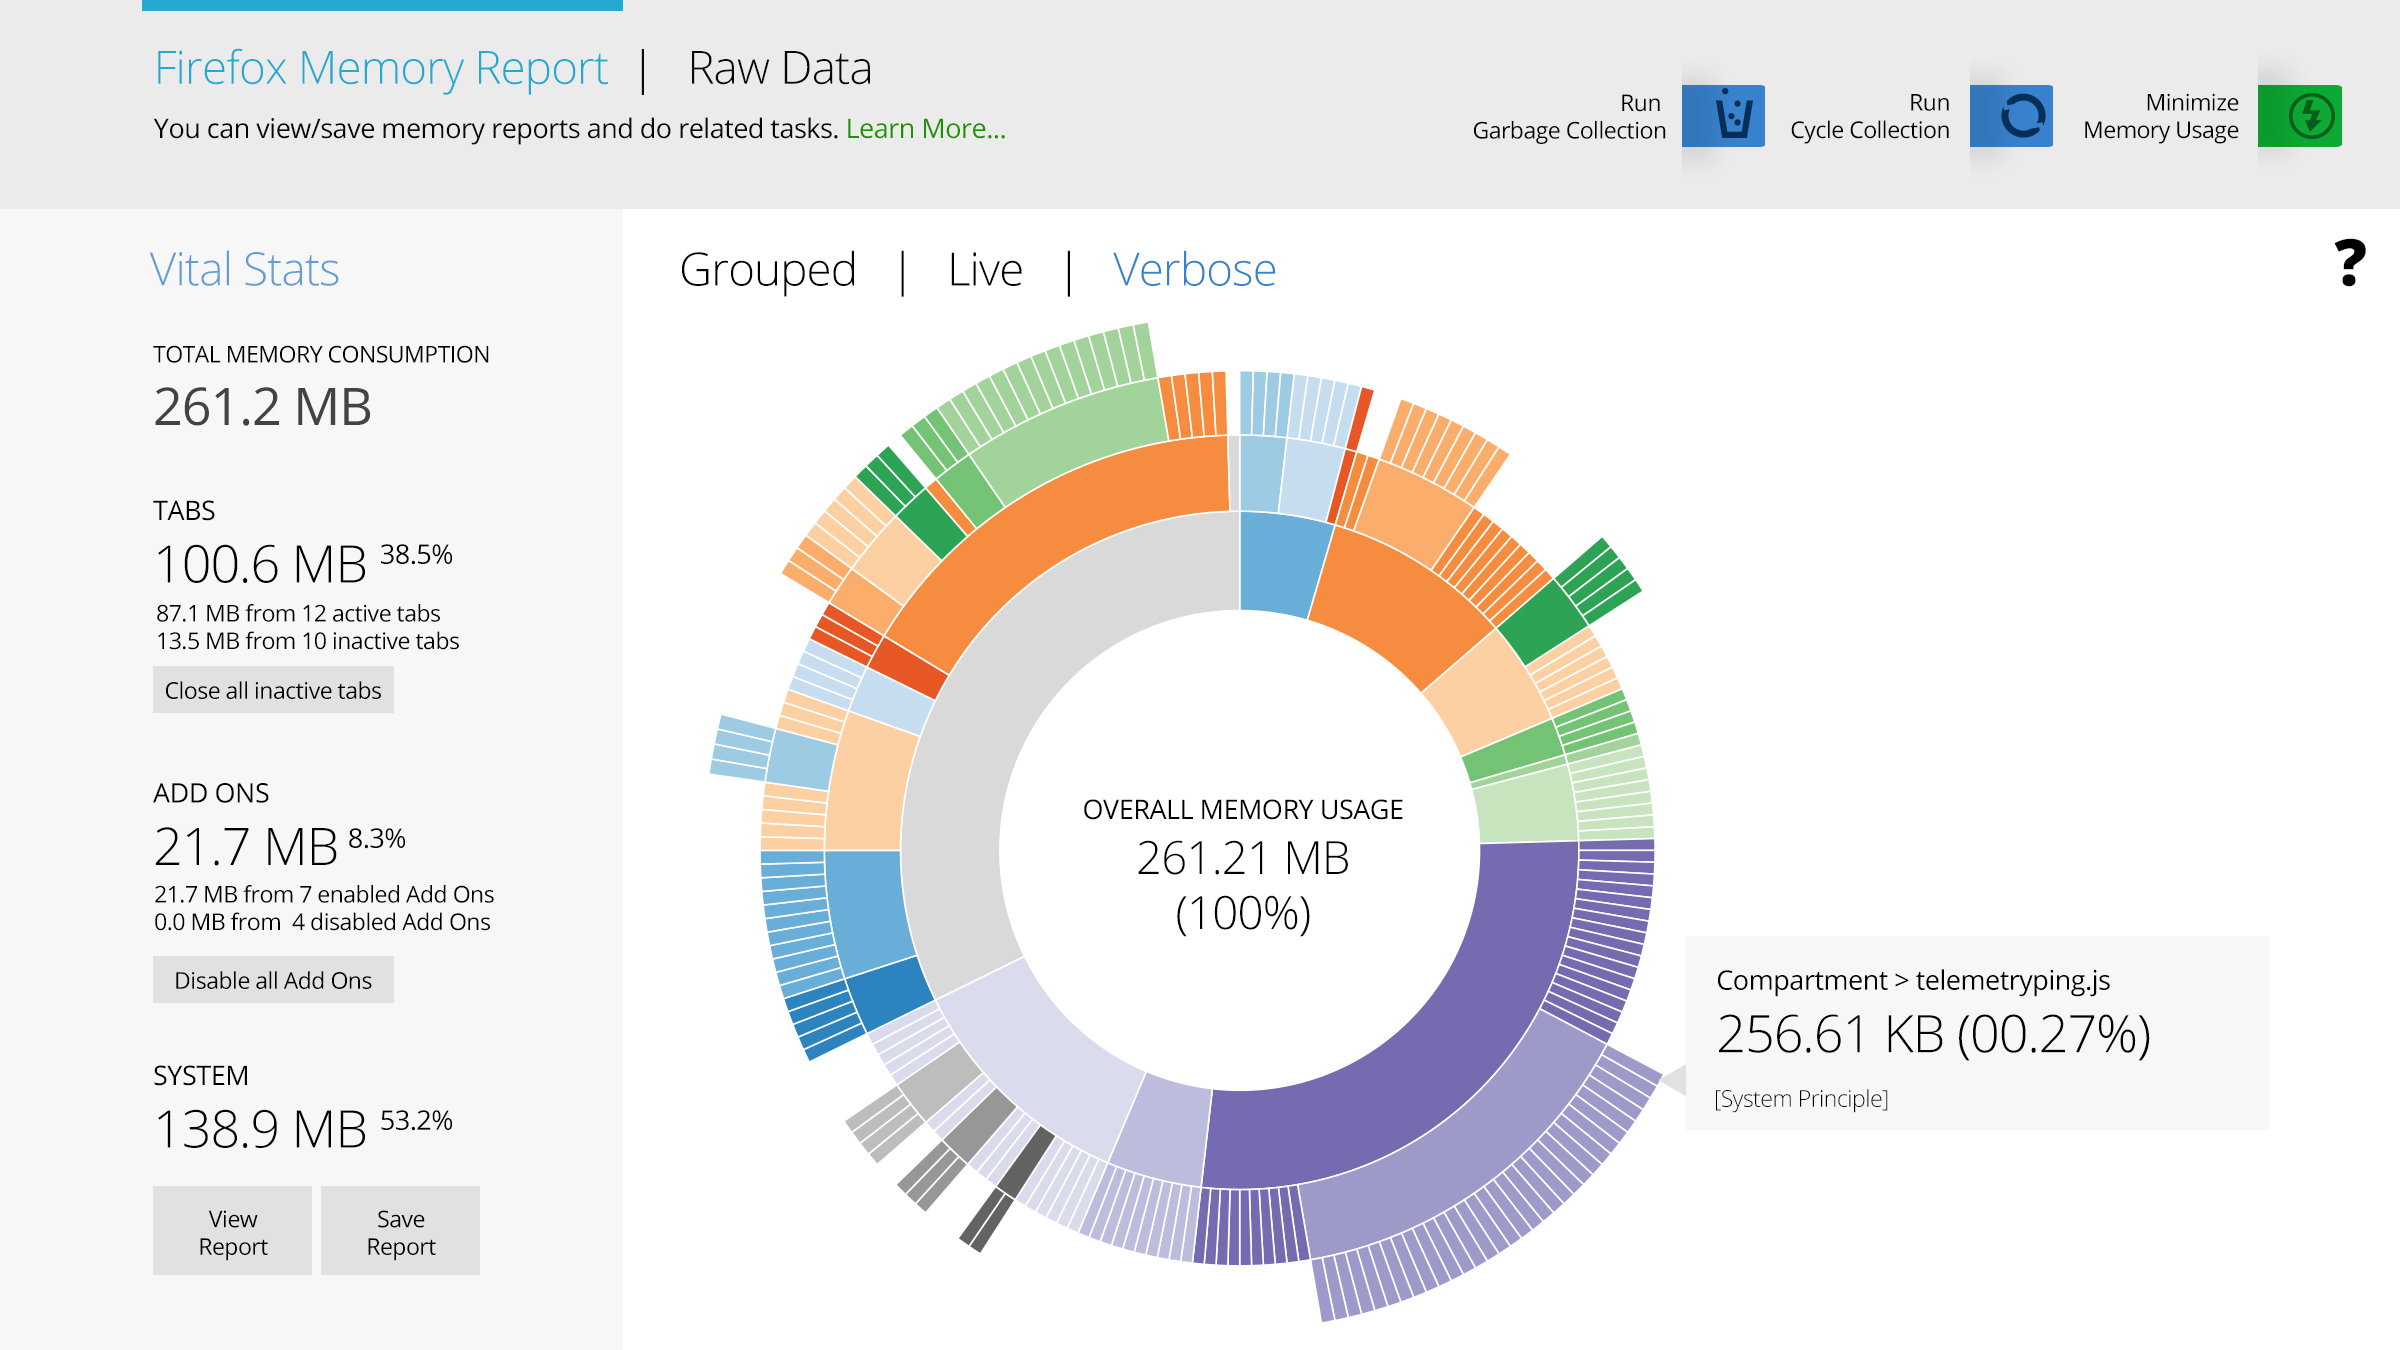 The Verbose view is essentially a sunburst chart showing the details of the verbose memory allocation tree. A sunburst chart is a hierarchical form of a donut chart that allows users to drill down to see metadata about each partition.
A sunburst chart is a visualization that allows comprehensive details to be accommodated in abstract forms in order to reduce the so-called cognitive friction . As above, hovering over the partitions of the chart will reveal more information about the consumption statistics.
The Verbose view is essentially a sunburst chart showing the details of the verbose memory allocation tree. A sunburst chart is a hierarchical form of a donut chart that allows users to drill down to see metadata about each partition.
A sunburst chart is a visualization that allows comprehensive details to be accommodated in abstract forms in order to reduce the so-called cognitive friction . As above, hovering over the partitions of the chart will reveal more information about the consumption statistics.
From several posts on the MemShrink project blog, I observed that developers were keen to find out memory leaks due to pages/add-ons/extensions from the memory tree on about:memory. Though this project focuses more on everyday users, power users and developers can always benefit if there is an option of an advanced view that can point out possible memory leaks or highlights entities that consume disproportionately large amounts of memory or portray abnormal behavior.
This project was built using D3.js for layout calculations as well as rendering.