Wattalyst
Energy Visualizations for Wattalyst @ IBM Research
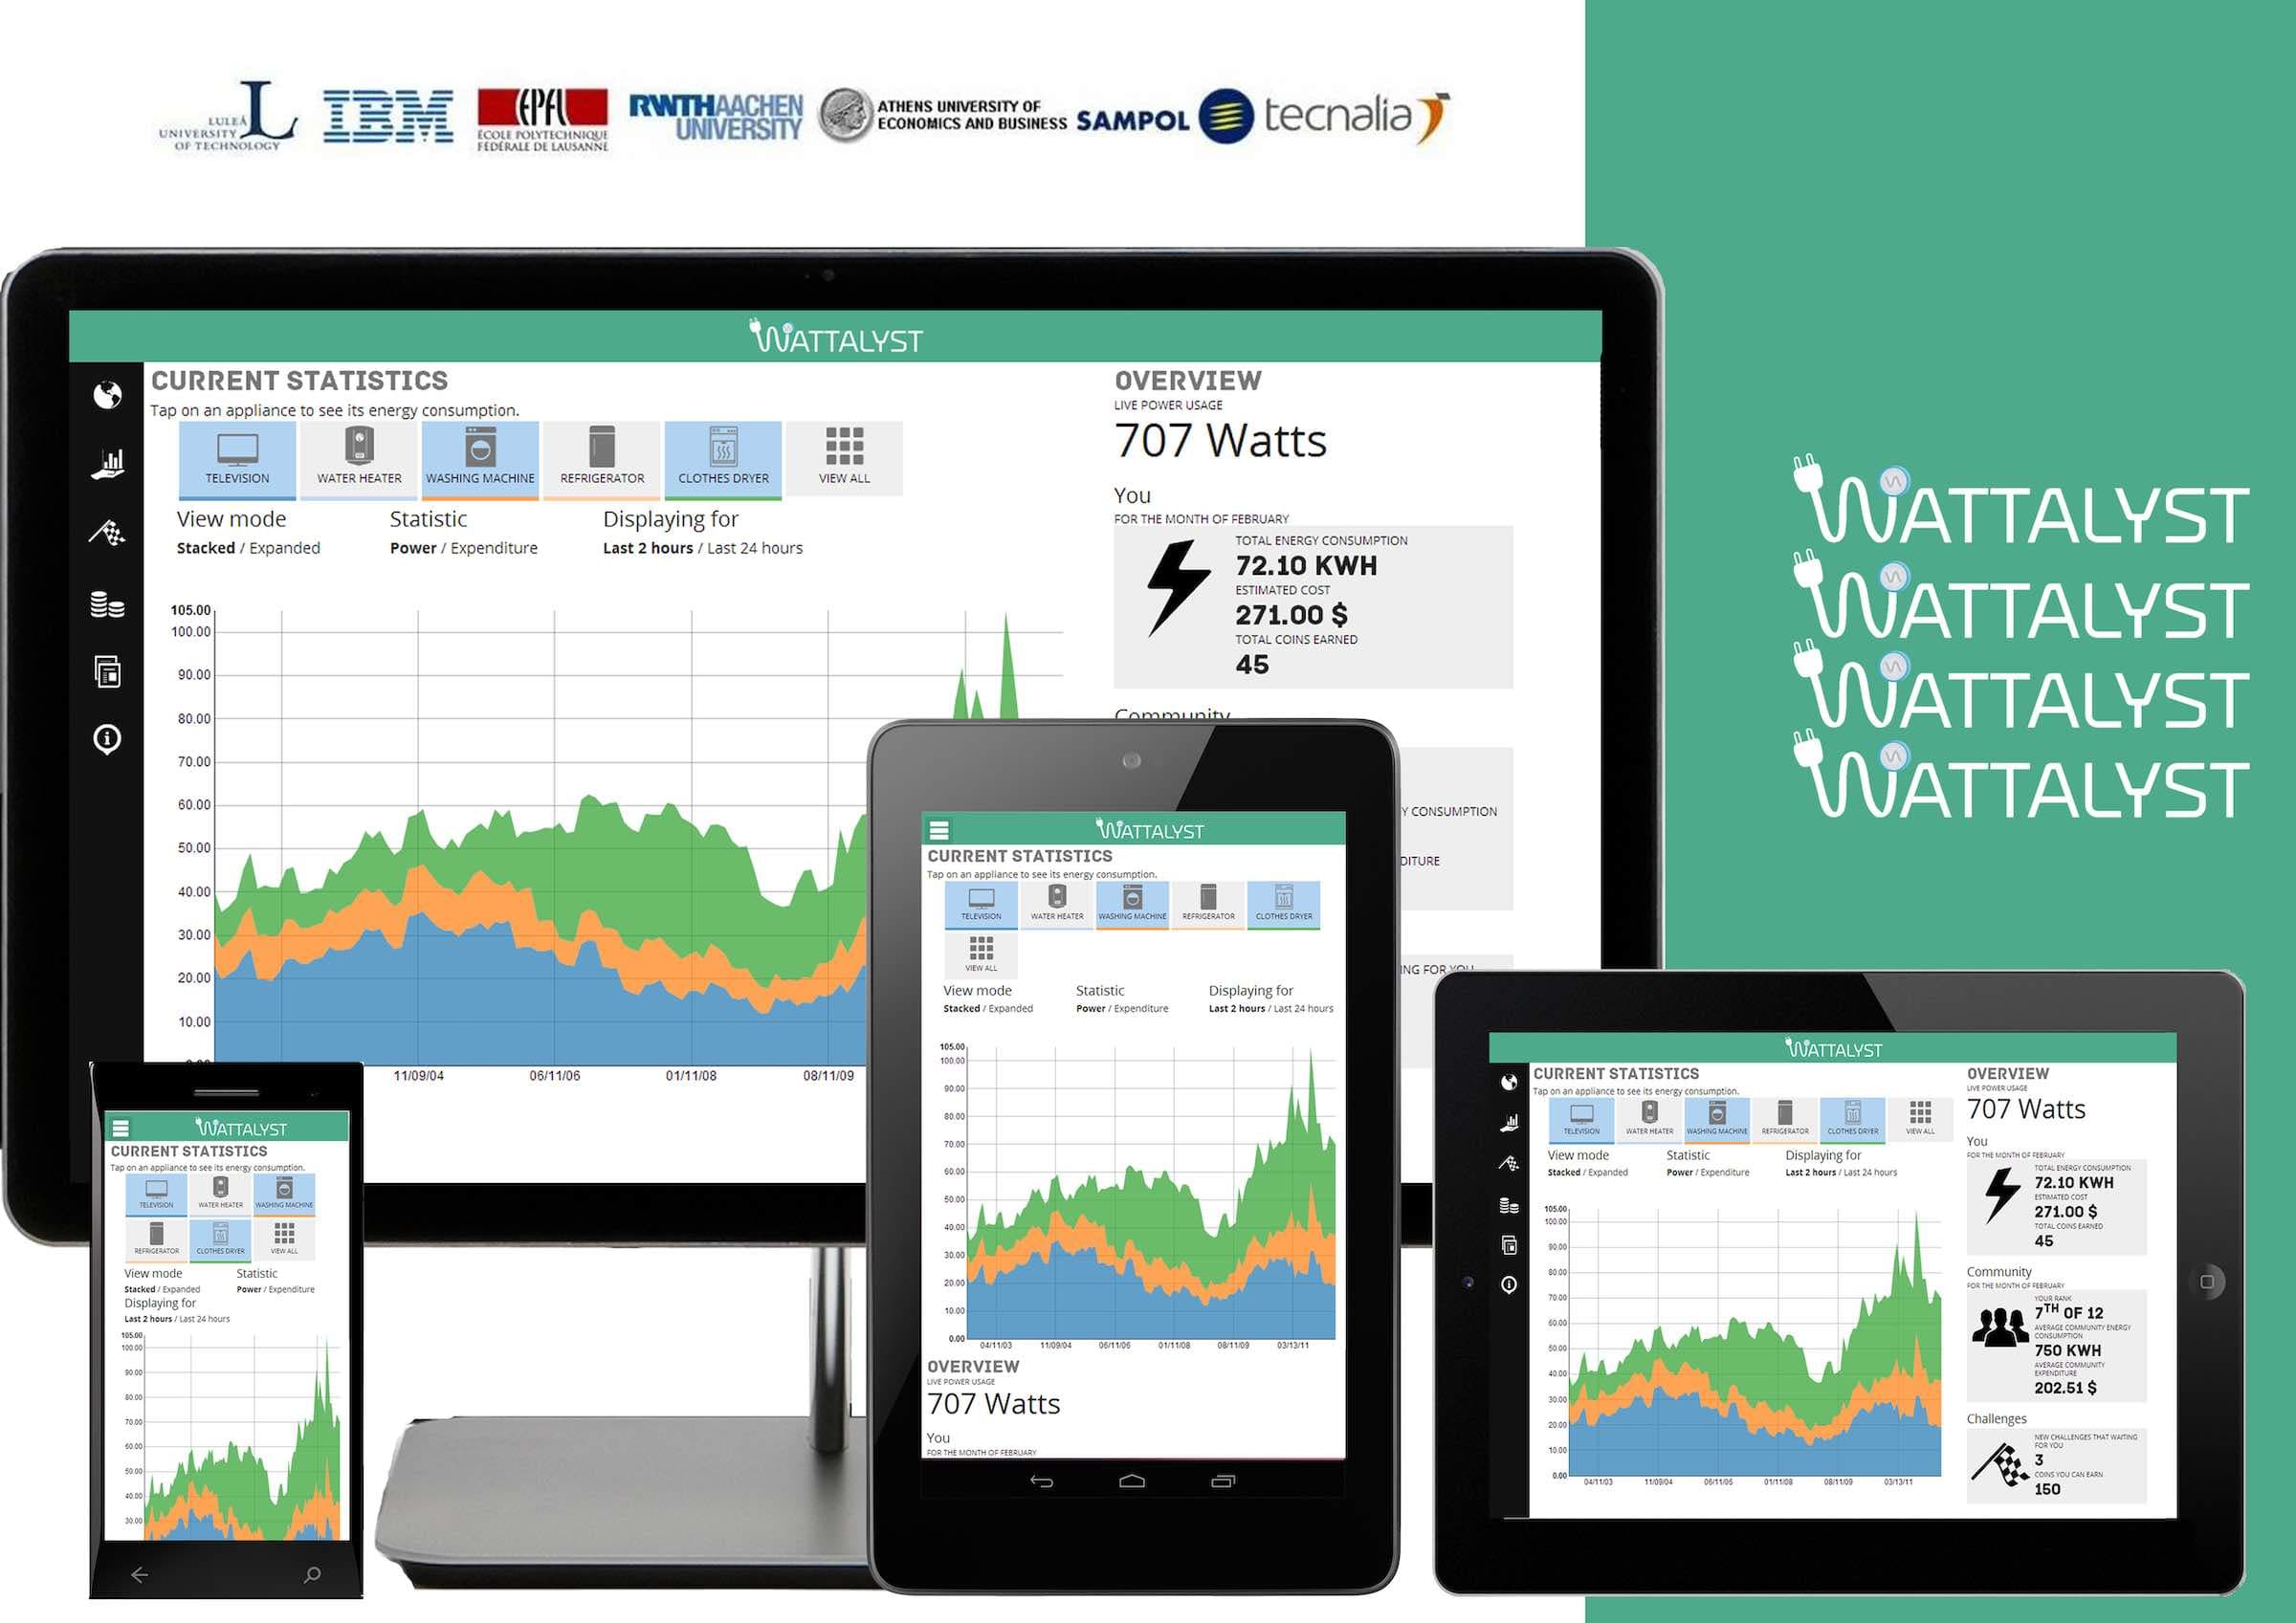
As a DR (Demand-Response) designer at IBM Research I designed and built interactive visualizations for Project Wattalyst showing real-time data coming from a smart electrical micro-grid to expose the underlying demand patterns and decide further responses. It was an exciting opportunity to prove the power of visualization on energy conservation and connected smart communities.
This project was commissioned by the European Union along with six prominent worldwide academic and professional organizations. These included Ecole Polytechnique Federale de Lausanne Switzerland, Rheinisch-Westfaelische Technische Hochschule (RWTH), Aachen Germany, Fundacion Tecnalia Research & Innovation – Spain, Sampol Ingenieria Y Obras S.A. Spain, Athens University of Economics and Business – Greece, and IBM Research.
It was a privilege to work with such esteemed organizations, and my work on Project Wattalyst was deployed in several small towns and villages across the European Union.
WATTALYST (WATT anALYSis Technologies) will address this need by establishing correlations between electricity consumption (monitored on a fine-grained basis) and the factors that influence demand side participation. It is a EU FP7 project with the consortium comprising of 7 partners. WATTALYST aims to understand in what context and how would consumers reduce demand. For example, identifying the loads (e.g. washing machines, electric vehicles) that can be shifted and those that cannot; and identifying the loads that are reduced (e.g. cooling, heating) and those that are not are all user/house-hold specific and varies based on the need of the hour. Another goal of WATTALYST is to understand effective methods of conveying the DR signals to the users. In particular, the research will focus on interface design; communication means (in-house displays, SMS messages), message emphasis (environmental, economical) and customized messages based on gender, age and profile.
