Datadog
DataViz lead at Datadog
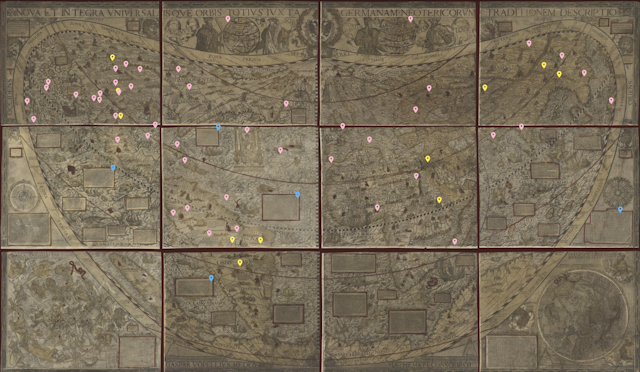
Amerasia
Cartography before cartograpy - building a navigable interactive version for an ancient map
OpenGL Gravitation Particle Engine

Mapping IFA Alumni
Visualizing the Institute of Fine Arts alumni and their current roles as a reference for prospective students
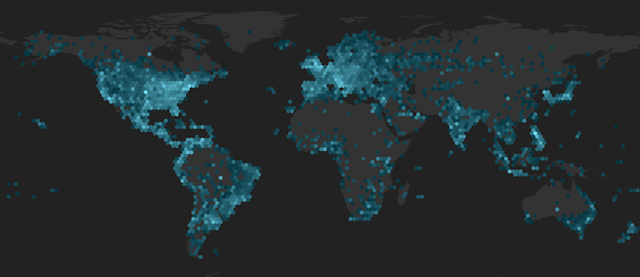
Cartographic visualizations @ Twitter
Visualizing tweets, trends, followers and impact on a map over time @ Twitter
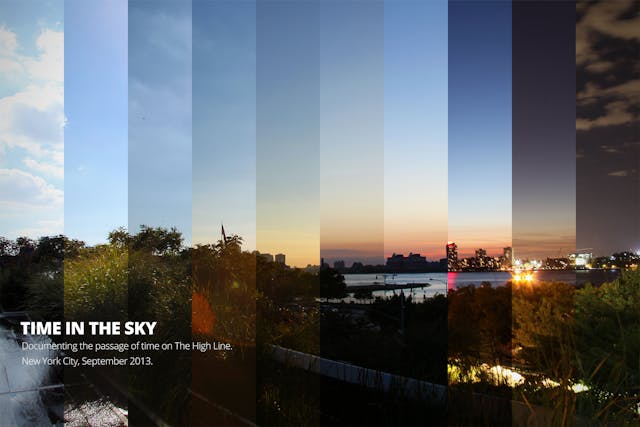
Time in the Sky
A responsive documentary film showcasing a diverse set of people all experiencing The Highline park in NYC in a shared moment.
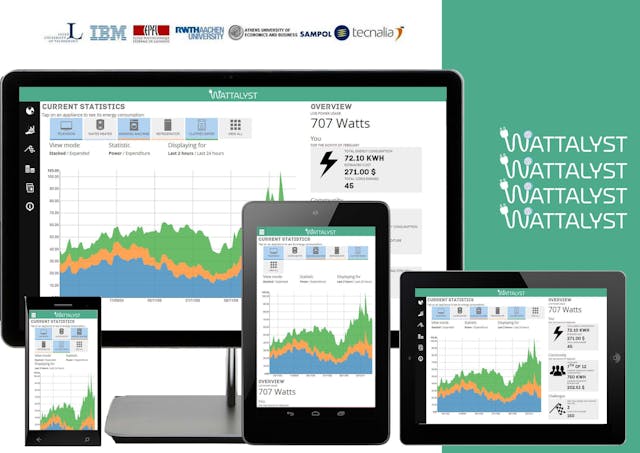
Wattalyst
Energy visualizations for an EU project | Dataviz at IBM Research
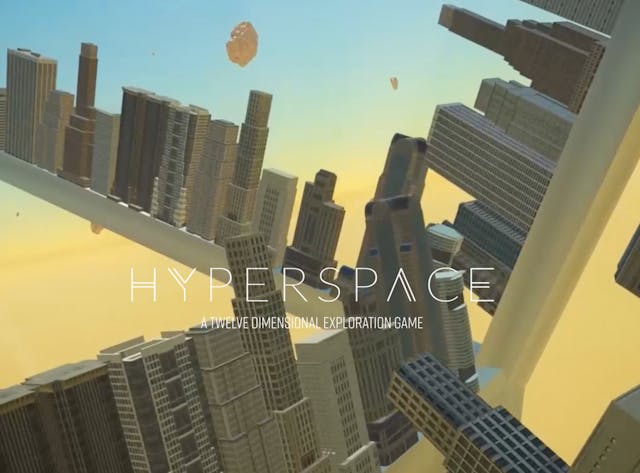
Hyperspace
An experimental high-dimensional game
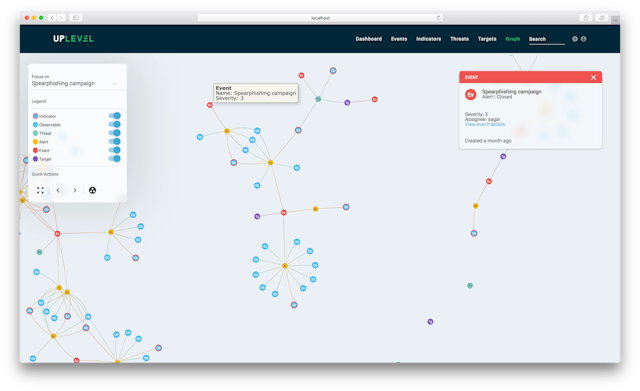
Uplevel - security observability visualizations
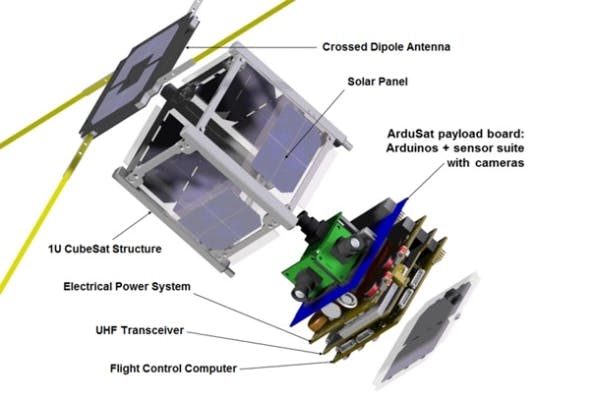
Ardusat
Visualizing sensor telemetry and building an educational platform for students to run experiments @ Ardusat
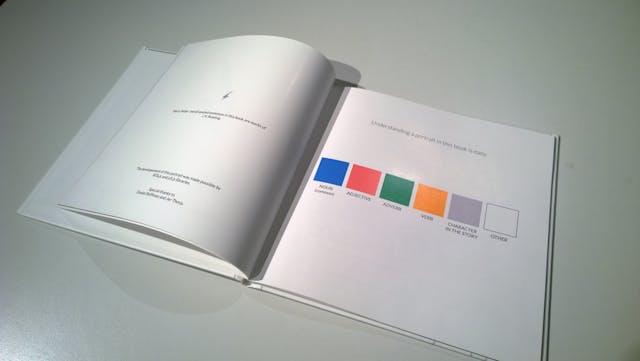
Colorpress
Abstract data portraits of books
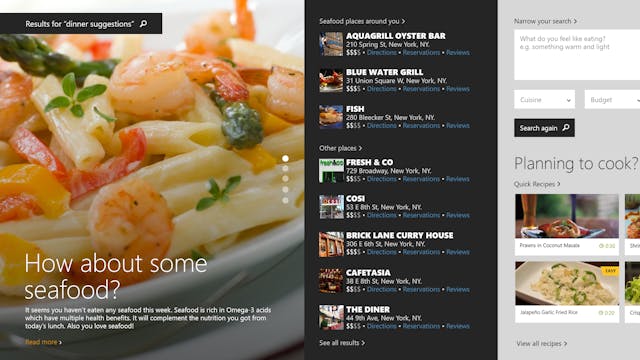
Rethinking responsive search in a connected world
Design thought experiment on context-preserving and privacy-focused search

Firefox memory viz
Visualizing process profiles and memory utilization for Firefox
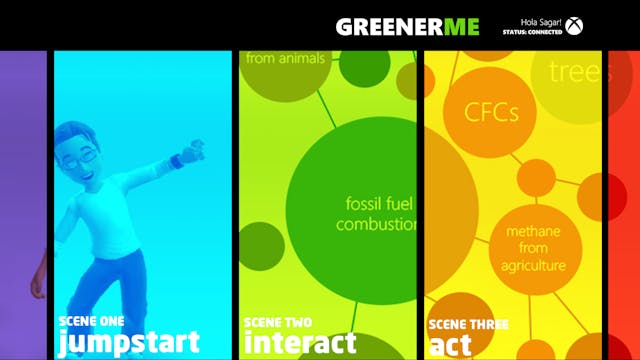
Greener Me
Experimental data-driven game about carbon emissions

@graph-viz library
An open-source WebGL library to draw large graph diagrams
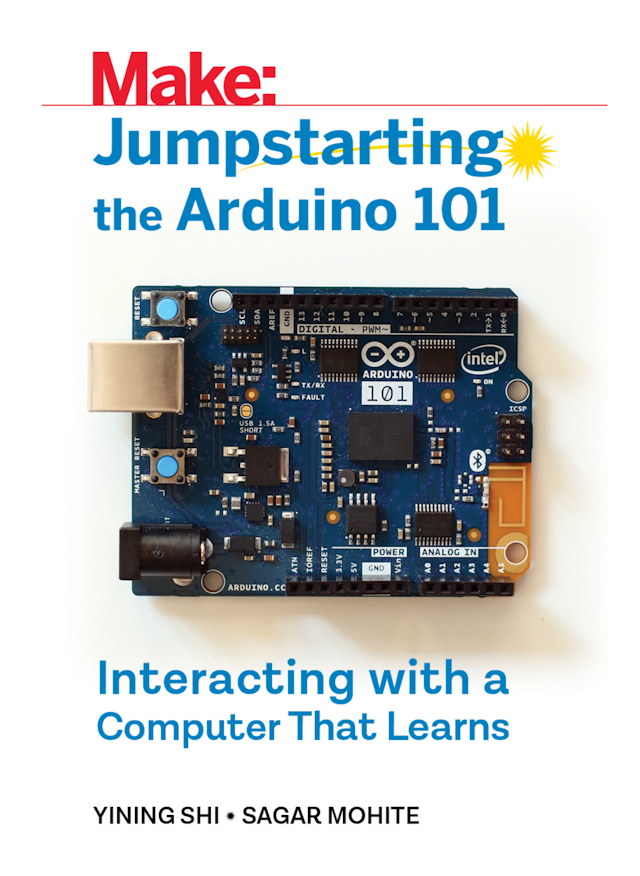
Jumpstarting the Arduino 101
A book we published for Make about embedded Machine Learning with the BLE powered Arduino 101 board
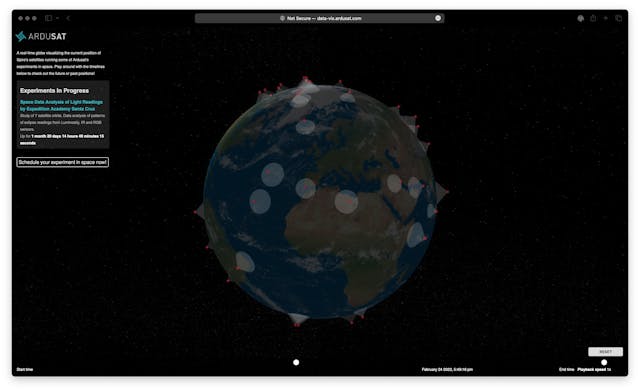
Ardusat Satellite Tracker
Visualizing real-time positions of Ardusat's nano-satellites in the lower Earth orbit.
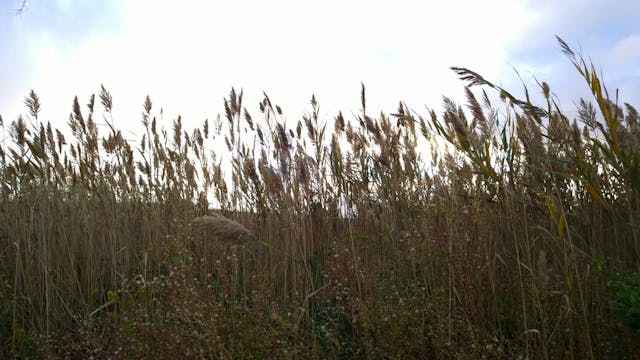
Oakwood Beach Returns to the Wild
An interactive film documenting the aftermath of hurricane Sandy in Staten Island, NY
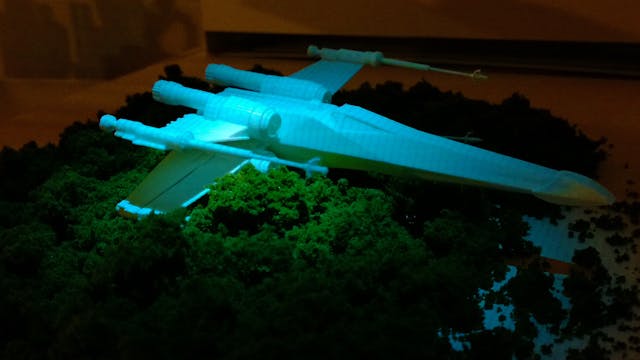
The Force
An interactive CV-driven art installation
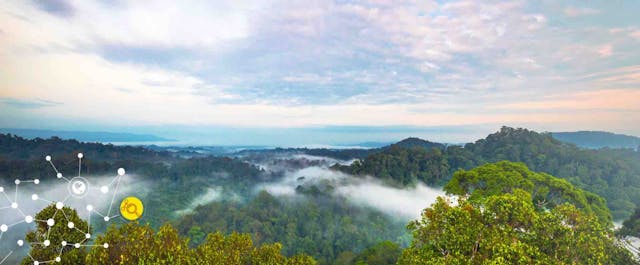
Demand-Response Visualizations
Microgrid Visualizations at a biological field station, Kuala Belalong Field Studies Centre | Dataviz at IBM Research
Low carbon apps
A set of region-specific carbon footprint calculators built in collab with an environmental engineer